Required Software
Tableau Reader is a free software which can be used to open any of the interactive dashboards and infographics available to Community Data Program members. Tableau Reader can be downloaded for free here.
For more detailed instructions on installing and using Tableau Reader, see the Instructions section below.
If you have any questions about our dashboards, email us at information@communitydata.ca.
Dashboards
Demographics
Village of 100 Dashboard, 2016Image

This interactive Tableau dashboard presents a selection of indicators for a geography of your choosing, as if it were a village of 100 people. |
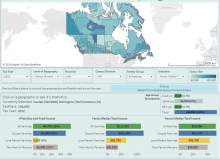
Census Population 2021 DashboardImage

The 2021 Census Population Dashboard displays population and household data from Statistics Canada's 2021 Census. Population values are compared with those from the 2016 Census and across geographies using an interactive map. The data in this dashboard covers all of Canada. |
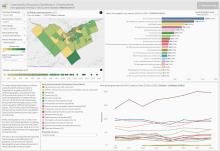
Regional Profile Dashboard, 2016Image

The Regional Profile Dashboard provides a detailed overview for a geography of your choosing, using Census Profile indicators relating to census families, households, demographics, employment, income and education. In addition to PT, CD CSD, CA and CMA geographies, this dashboard allows you to view profiles of census tracts, as well as compare and rank indicators across census tracts in a CMA or CA using interactive maps and charts. |
Census Profile 2021: Non-Official Languages DashboardImage

The 2021 Census Profile: Non-Official Languages Dashboard displays data on non-official languages from Statistics Canada's 2021 Census Profile. This dashboard contains an interactive map and allow users to view the top non-official languages spoken in a selected census tract. |
Census Profile 2021: Linguistic Diversity DashboardImage

The 2021 Census Profile: Linguistic Diversity Dashboard displays data from Statistics Canada's 2021 Census Profile on the topic of linguistic diversity and use of English and French in Canada. This dashboard allows users to view 2021 Census indicators in an interactive map and generate detailed profiles of individual geographies. |
Immigration & Population Mobility
Immigration and Housing Dashboard, 2021Image
This dashboard presents data from a collaboration between the Community Data Program and the National Local Immigration Partnership Secretariat. While its primary focus is on housing characteristics, we have also extracted additional insights from the data source, resulting in the inclusion of tabs beyond housing-related topics. |
Longitudinal Immigration Database Dashboard, 2015-2021Image
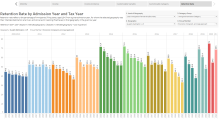
The Longitudinal Immigration Database Dashboard presents data from IMDB tables 1-10 in a series of interactive charts. The charts compare data on immigrant taxfiler mobility and income with admission categories, world areas of birth, known languages, citizenship status, pre-admission experience, age, and gender covering the tax years 2015 to 2021. An instructional video for the Longitudinal Immigration Database Dashboard, 2015-2021 is available here. |
Immigration Profile Dashboard, 2021Image
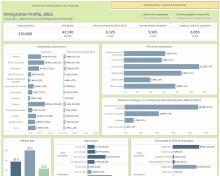
The Immigration Profile Dashboard, 2021 displays a profile of the immigrant population in a selected community, using data from the 2021 Census. The dashboard provides an overview of immigration and looks at demographics, language, education, employment, income, and housing for the immigrant and recent immigrant populations. The data in this dashboard covers all of Canada at the following levels of geography: Canada, Provinces and Territories (PR), Census Divisions (CD), Census Subdivisions (CSD), and Local Immigration Partnership (LIP) boundaries. |
Census Profile 2021: Immigration, Mobility, Ethnocultural and Religious Diversity DashboardImage

The 2021 Census Profile: Immigration, Mobility, Ethnocultural and Religious Diversity Dashboard displays data from Statistics Canada's 2021 Census Profile on the topics of immigration, place of birth, mobility, and ethnocultural and religious diversity. This dashboard allows users to view 2021 Census indicators in an interactive map and generate detailed profiles of individual geographies. |
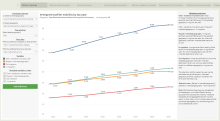
Mobility In and Out of Local Immigration Partnerships DashboardImage

The Mobility In and Out of Local Immigration Partnerships Dashboard visualizes immigrant mobility data for custom LIP geographies using the Longitudinal Immigration Database [IMDB]. This dashboard allows you to compare mobility indicators by immigration admission category, admission year (or landing year), tax year, age and gender of immigrant taxfilers |
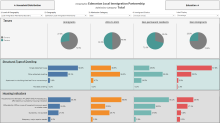
Longitudinal Immigration Database ICARE Dashboard, 2012-2019Image
The Longitudinal Immigration Database ICARE Dashboard presents data from the IMDB ICARE tables T1 and T2 in a series of interactive charts. Data on immigrant taxfiler mobility and economic outcomes are compared with settlement service delivery, admission categories and world areas of birth. The dashboard includes time series showing data on immigrant taxfiler landing groups over time, and charts showing data for individual tax years. |
Profile: All Immigrants, 2016Image
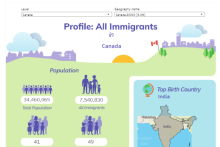
This interactive Tableau dashboard allows you to view a selection of census variables for the immigrant population at a geography of your choice. Click here to download this dashboard from the catalogue.
|
Profile: Recent Immigrants, 2016Image
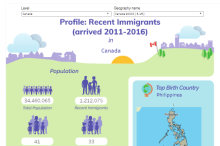
This interactive Tableau dashboard allows you to view a selection of census variables for the recent immigrant (period of immigration 2011-2016) population at a geography of your choice. |
Housing & Affordability
Community Rental Housing Affordability Dashboard, Version 1.0Image
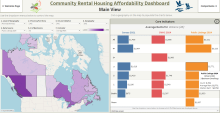
This dashboard provides timely insights into rental housing affordability across Canada by analyzing recent online rental listings. It aims to complement traditional data sources like the Census and CMHC surveys, which have significant reporting delays and cover gaps, especially in smaller communities and for the secondary rental markets. Use this tool to explore current asking rents, compare trends across different data sources, and understand rental market dynamics in your community. |
Housing Dashboard - Version 2Image
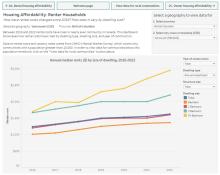
The Housing Dashboard is an interactive data storytelling tool, helping users to understand and tell stories about housing in their communities. The dashboard guides users through a selection of housing indicators from sources including Statistics Canada and CMHC, offering questions and relevant information to guide interpretation of the data. There are four parts in the dashboard, with each intending to answer a different question about housing. These questions relate to the topics of housing supply and demand, housing affordability, choice in the housing market, and core housing need. Version 2 of the Housing Dashboard covers the same variables as the previous version, but all Census data has been updated to 2021, and the time series using data from CMHC and Statistics Canada have been updated to include the latest available data points (up to 2022). |
Housing Dashboard - Version 1Image

The Housing Dashboard is an interactive data storytelling tool, helping users to understand and tell stories about housing in their communities. The dashboard guides users through a selection of housing indicators from sources including Statistics Canada and CMHC, offering questions and relevant information to guide interpretation of the data. There are four parts in the dashboard, with each intending to answer a different question about housing. These questions relate to the topics of housing supply and demand, housing affordability, choice in the housing market, and core housing need. |
Community Decision Support Tool for Housing Issues: Demonstration VersionImage

The Community Decision Support Tool for Housing Issues: Demonstration Version displays data from Statistics Canada and CMHC on the subject of housing. |
Census Profile 2021: Housing and Indigenous Identity DashboardImage

The 2021 Census Profile: Housing and Indigenous Identity Dashboard displays data from Statistics Canada's 2021 Census Profile on the topics of Indigenous Identity, types and sizes of dwellings, housing affordability, core housing need, tenure and primary household maintainers. This dashboard allows users to view 2021 Census indicators in an interactive map and generate detailed profiles of individual geographies. |
Census Profile 2021: Families and Households DashboardImage

The 2021 Census Profile: Families and Households Dashboard displays data from Statistics Canada's 2021 Census Profile on the topics of marital status, household type, family size and type, and persons not in census families. This dashboard allows users to view 2021 Census indicators in an interactive map and generate detailed profiles of individual geographies. |
Census Profile 2021: Age, Gender, Household Size and Dwelling Type DashboardImage

The 2021 Census Profile: Age, Gender, Household Size and Dwelling Type Dashboard displays population and household data from Statistics Canada's 2021 Census Profile. This dashboard allows users to view 2021 Census indicators in an interactive map and generate detailed profiles of individual geographies. |
Racialized Households Profile Dashboard, 2021Image
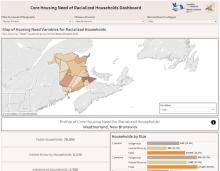
The Racialized Households Profile Dashboard, 2021 provides an overview of Indigenous households and visible minority households, looking at household size, tenure, core housing need and more, using data from the 2021 Census. This dashboard allows you to compare variables across geographies in an interactive map, and view detailed profiles of individual geographies. |
Housing Profile Dashboard, 2016Image

The Housing Profile Dashboard provides an overview of housing indicators for a geography of your choosing, using data from the 2016 Census. In addition to viewing profiles of PT, CD CSD, CMA, CA and CT geographies, this dashboard allows you to compare and rank indicators across census tracts in a CMA or CA using interactive maps and charts. |
Employment & Education
Employment Profile Dashboard, 2021Image

The Employment Profile Dashboard, 2021 provides an overview of employment indicators for a selected geography, using data from the 2021 Census. This dashboard allows you to compare education variables across geographies in an interactive map, and view detailed profiles of individual geographies. |
Employment Profile Dashboard, 2016Image

The Employment Profile Dashboard provides an overview of employment indicators for a geography of your choosing, using data from the 2016 Census. In addition to viewing profiles of PT, CD CSD, CMA, CA and CT geographies, this dashboard allows you to compare and rank indicators across census tracts in a CMA or CA using interactive maps and charts. |
Census Profile 2021: Education, Labour Force and Commuting DashboardImage

The 2021 Census Profile: Education, Labour Force and Commuting Dashboard displays data from Statistics Canada's 2021 Census Profile on the topics of educational attainment, fields of study, labour force status and employment, commuting, as well as employment by occupation and industry. This dashboard allows users to view 2021 Census indicators in an interactive map and generate detailed profiles of individual geographies. |
Education Profile Dashboard, 2021Image
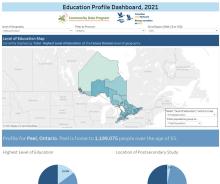
The Education Profile Dashboard, 2021 provides an overview of education indicators for a geography of your choosing, using data from the 2021 Census. This dashboard allows you to compare education variables across geographies in an interactive map, and view detailed profiles of individual geographies. |
Education Profile Dashboard, 2016Image

The Education Profile Dashboard provides an overview of education indicators for a geography of your choosing, using data from the 2016 Census. In addition to viewing profiles of PT, CD CSD, CMA, CA and CT geographies, this dashboard allows you to compare and rank indicators across census tracts in a CMA or CA using interactive maps and charts. |
Community workforce development
Community Profile Infographics - Demographic ProfileImage
This interactive infographic provides a demographic overview for the population in a selected province, territory, census division or census subdivision, using 2021 Census data. An interactive map and bubble chart are included for comparing select variables across geographies. Click here to download this infographic from the catalogue. Version française/French version: Profils des communautés - Profil démographique, 2021 |
Community Profile Infographics - Labour Force and IncomeImage
This interactive infographic provides a profile of employment, work activity, class of work, and income for the labour force in a selected province, territory, census division or census subdivision, using 2021 Census data. An interactive map and bubble chart are included for comparing select variables across geographies. Click here to download this infographic from the catalogue. Version française/French version: Profils des communautés - Population active, 2021 |
Community Profile Infographics - OccupationImage
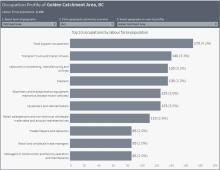
This interactive infographic provides a profile of the top 10 occupations in a selected province, territory, census division or census subdivision, using 2021 Census data. Click here to download this infographic from the catalogue. Version française/French version: Profils des communautés - Profession, 2021 |
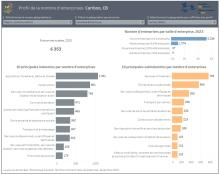
Community Profile Infographics - IndustryImage
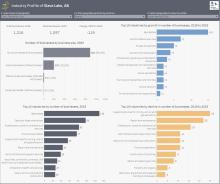
This interactive infographic provides a profile of businesses in a selected province, territory, census division or census subdivision, using Canadian Business Counts June 2018 and June 2023 data. The topics covered include change in total business counts, business size, as well as top industries by growth, decline and number of businesses. Click here to download this infographic from the catalogue. Version française/French version: Profils des communautés - Industrie, 2018-2023 |
Community Profile Infographics - CommutingImage
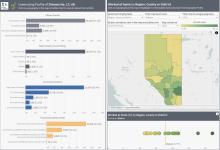
This interactive infographic provides a profile of commuting for the labour force in a selected province, territory, census division or census subdivision, using 2021 Census data. The topics covered include place of work, mode of commuting, commute durations and destinations. An interactive map and bubble chart are included for comparing select variables across geographies. Click here to download this infographic from the catalogue. Version française/French version: Profils des communautés - Navettage, 2021
|
Community Profile Infographics - Population ChangeImage
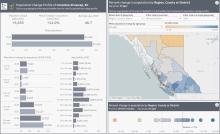
This interactive infographic provides a profile of population change across age groups in a selected province, territory, census division or census subdivision, using 2021 Census data. An interactive map and bubble chart are included for comparing population change across geographies. Click here to download this infographic from the catalogue. Version française/French version: Profils des communautés - Variation de la population, 2016-2021
|
Community Profile Infographic - Clean EconomyImage
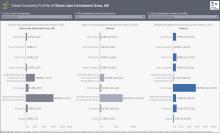
This interactive infographic compares the labour force population in a selected census division or census subdivision to provincial greenhouse gas emissions and labour force population, broken down by economic sector. Click here to download this infographic from the catalogue. Version française/French version: Profils des communautés - Économie propre, 2021 |
Community Profile Infographic - Business Count Profile, December 2023Image
This interactive infographic provides a profile of businesses by business size and industry, in a selected province, territory, census division or census subdivision, using Canadian Business Counts, December 2023 data. Click here to download this infographic from the catalogue. Version française/French version: Profils des communautés - Profil de la nombre d'enterprises, Décembre 2023 |
Economic & Financial Well-being
Canadian Business Counts Dashboard (2019, 2022, 2025)Image
The dashboard provides data on business counts across Canada disaggregated by North American Industry Classification System (NAICS) classification. It displays the number of business locations within each geographic area. Data is organized by provinces and territories, census divisions, and census subdivisions, and includes both community profiles for a selected year and comparisons over time, as well as cross-geography comparisons. |
Taxfiler F-01 DashboardImage
The Taxfiler F-01 Dashboard displays data from the F-01 Summary census family income table for 2019, 2020, 2021, and 2022. The F-01 table includes the number of taxfilers and census families, as well as their median values for total income, employment income, government transfers, and employment insurance. |
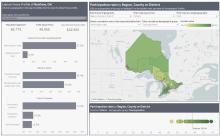
Liquid Assets DashboardImage

The Liquid Assets Dashboard represents the modeled estimate of 2016 mean liquid assets of economic families and persons not in economic families at the census division (CD) level which is produced by Statistics Canada. Two data sets were used to obtain the final estimates: the 2016 Survey of Financial Security (SFS) and the 2016 Census of Population. |
Census Profile 2021: Income DashboardImage

The 2021 Census Profile: Income Dashboard displays data from Statistics Canada's 2021 Census Profile on the topics of of individual, household and family income, as well as low income and income inequality. This dashboard allows users to view 2021 Census indicators in an interactive map and generate detailed profiles of individual geographies. |
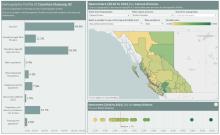
Low Income Profile Dashboard, 2021Image
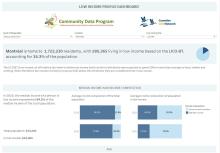
Low Income Profile Dashboard, 2021 provides an overview of the low income population in a selected census subdivision, census division, province or territory. The dashboard uses data from the 2021 Census Target Group Profiles to look at the low income populations defined by five different low income lines: MBM, LIM-AT, LIM-BT, LICO-AT, and LICO-BT. These populations are compared with the total population and broken down by demographic characteristics, age, education, and source of income. |
Income Profile Dashboard, 2016Image

The Income Profile Dashboard provides an overview of income indicators for a geography of your choosing, using data from the 2016 Census. In addition to viewing profiles of PT, CD CSD, CMA, CA and CT geographies, this dashboard allows you to compare and rank indicators across census tracts in a CMA or CA using interactive maps and charts. |
Poverty Profile Dashboard, 2016Image

The Poverty Profile Dashboard provides an overview of poverty indicators for a geography of your choosing, using data from the 2016 Census. In addition to viewing profiles of PT, CD CSD, CMA, CA and CT geographies, this dashboard allows you to compare and rank indicators across census tracts in a CMA or CA using interactive maps and charts. |
Community Recovery & Health
Community Recovery Dashboard - Version 4Image
The Community Recovery Dashboard is a monitoring tool for medium and long term COVID-19 recovery. The dashboard uses data from sources including the 2021 Census and the Labour Force Survey, to examine the effects of the pandemic and compare them across Canadian geographies and demographic groups. Topics covered in this dashboard include place of work, commuting, income, and employment change across industries. The dashboard allows you to view profiles of individual geographies across Canada, ranging in scale from national to neighbourhood-sized, as well as compare select indicators across geographies using interactive maps and charts. |
Community Recovery Dashboard - Version 3Image

The Community Recovery Dashboard is a monitoring tool for medium and long term COVID-19 recovery. The dashboard uses data from the Census and Labour Force Survey to look at the state of geographic areas across Canada prior to the COVID-19 pandemic, in order to assess and compare their capacities for recovery from COVID-19's economic and health impacts. The dashboard allows you to view profiles of individual geographies across Canada, ranging in scale from national to neighbourhood-sized, as well as compare select indicators across geographies using interactive maps and charts. |
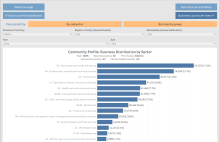
Community Health Profile DashboardImage

The Community Health Profile Dashboard provides a health overview of health regions across Canada, using data from the 2017/2018 Canadian Community Health Survey, including smoking frequency, access to a regular healthcare provider, and prevalence of hearth disease. These indicators are compared across the total, immigrant, recent immigrant populations. |
Tableau Webinars
- February 4, 2025: Refresher on the Community Data Program’s Tableau Infographics and Dashboards
- February 27, 2024: Orientation to the Community Data Program’s Tableau Infographics and Dashboards
- July 27, 2023: Immigration Data Portal: Orientation to ICARE, IMDB and 2021 Census Data Tables, Dashboards and Infographics
- February 8, 2023: Community Data Program Open Forum
- April 26, 2022: Adapting the Community Recovery Dashboard to serve local priorities: Lessons learned from the Social Planning Council of Ottawa
- March 1, 2022: Data visualization workshop - From the CDP catalogue to creating Tableau dashboards
- June 1, 2021: CDP Members Monitoring COVID-19
- November 24, 2020: Doing More with Tableau
- October 20, 2020: Introduction to Tableau
See the full list of upcoming and past webinars here. Recordings are available for most past webinars.
Instructions
Installing Tableau Reader
In order to view any of the Community Data Program's Tableau products, you will need Tableau Reader installed on your computer. Tableau Reader is a free program that allows you to open and interact with Tableau packaged workbook files (.TWBX), the format in which our dashboards and infographics are available.
Tableau Reader can be downloaded here. Click the Download Tableau Reader button and the download should begin immediately.
Open the downloaded file to install the software on your computer. Once Tableau Reader is installed, double-clicking a packaged workbook file should open it automatically. If this is not the case, right-click the packaged workbook then select Open with > Tableau Reader. Alternatively, you can start Tableau Reader first, then use File > Open to locate and open a packaged workbook file.
After opening a packaged workbook once, it should be easily accessible from Tableau Reader's start screen anytime open you the software, as long as you don't move or delete the file (if you do, just repeat these steps).
Using Tableau Reader
The main function of Tableau Reader is to allow you to open and interact with Tableau dashboards, however it does offer a few tools that are helpful to know:
- The arrows in the top-left are Undo and Redo buttons. You can use these to undo/redo any interaction with the dashboard.
- Clicking File > Revert to Saved or pressing the F12 key will reset the dashboard to its original state.
- Clicking File > Export As PowerPoint or File > Print to PDF allows you to export parts or all of the dashboard to a PowerPoint slideshow or a PDF document.
- Under the Story or Dashboard dropdown menus, there are options for exporting or copying the page you are viewing as an image.
Note that Tableau Reader is only for viewing and interacting with dashboards - it does not allow you to edit or extract data from them.
Using Community Data Program Tableau Dashboards
Each dashboard in the CDP catalogue offers slightly different functionality, so instructions will vary. However, all of our dashboards are designed to be intuitive to use and contain instructions within them. Every CDP dashboard covers all of Canada at varying levels of geography, and contains menus or maps for selecting your geography. Dashboards include a list of data sources and links to where you can download those datasets.
Resolving Tableau Display Issues (Windows)
If you're encountering issues with text or other objects displaying incorrectly in Tableau, it may be due to your display's text sizing settings. Here's how you can fix it:
Problem:
When your text size in Windows is set above 100%, Windows attempts to scale everything for a sharper display, which can distort the layout of Tableau. This is similar to zooming in on an image—details may become blurry, and Windows' software adjustments might cause layout issues in certain applications like Tableau.
Solution:
You can fix this issue with one of two methods. Both will restore the correct layout but may make Tableau appear slightly blurrier.
- Global Adjustment: Right-click your desktop and select Display settings, scroll down to Advanced scaling settings, and turn off Let Windows try to fix apps so they’re not blurry. This will affect all applications on your computer but can be toggled on or off as needed.
- Tableau-Specific Adjustment: Find the Tableau executable file (tableau.exe or tabreader.exe for Tableau Reader) by either right-clicking the Tableau icon in the Start menu and selecting Open file location, or by navigating to C:/Program Files/Tableau/Tableau 2024.2/bin or C:/Program Files/Tableau/Tableau Reader 2024.2/bin for Tableau Reader by default. Right-click tableau.exe or tabreader.exe and select Properties, then go to the Compatibility tab, click Change high DPI settings, check Override high DPI scaling behavior, and select Scaling performed by: System. Finally, click OK and Apply.
Alternatively, you can temporarily adjust your text sizing to 100% in the Display settings if needed.
About Tableau
Tableau is a data visualization and analysis platform, meaning it is a software for building and sharing interactive infographics and data tools. These tools are generally referred to as dashboards. With Tableau we intend to create dashboards that make it easier for CDP members to access and analyze data from our catalogue.
There are several different versions of Tableau available. The important ones to know for most users are:
Tableau Reader
Tableau Reader is a free software used to open and interact with Tableau dashboards. It opens Tableau Packaged Workbooks (.twbx) files, the format CDP dashboards are shared in. This version of Tableau cannot be used to create or edit dashboards, only view them. Tableau Reader is how we intend for CDP members to use our dashboards.
Tableau Desktop
Tableau Desktop is the premium Tableau software used to build and edit dashboards. This is where the CDP's dashboards are built. An annual or monthly subscription fee is required to access Tableau Desktop. This subscription also includes Tableau Prep, a software for editing datasets to prepare them for Tableau Desktop.
Tableau Public
Tableau Public is a free software for both creating and sharing Tableau Dashboards. It offers most of the functionality of Tableau Desktop and allows dashboards to be saved and shared online. However, Public has a few important limitations: dashboards are limited to 15 million rows of data, and they can only be saved to the Tableau Public server, where they become publicly available. Anyone with a link to the dashboard can view and share it. Tableau Public can be a helpful option for dashboards that are smaller in scale and are intended to be shared publicly.