This dashboard presents data from a collaboration between the Community Data Program and the National Local Immigration Partnership Secretariat. While its primary focus is on housing characteristics, we have also extracted additional insights from the data source, resulting in the inclusion of tabs beyond housing-related topics.
The data in this dashboard covers all of Canada at the following levels of geography:
- Canada
- Provinces and territories (PR)
- Census division (CD)
- Census subdivision (CSD)
- Local Immigration Partnership (LIP) boundaries
Each section of the dashboard features a set of dropdown menus that control the displayed data. To ensure smooth functionality, use the dropdowns in the order they are labeled. The final dropdown, 4. Immigrant Status, supports multiple selections.
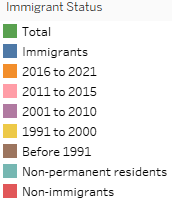
Each selected immigrant status appears as its own column across all tabs of the dashboard. While the immigrant statuses are only listed above the pie charts, they apply to all chart elements below their respective pie. The colour scheme (shown below) for immigrant statuses is applied to the barcharts and remains consistent throughout the dashboard.
Data source: Statistics Canada. Selected household and housing characteristics (102), Admission category and applicant type (13), Period of immigration (16) and Gender (3) for the Population in Private Households, 2021 Census - 25% Sample Data
https://communitydata.ca/data/selected-household-and-housing-characteri…
This dashboard was released February 20th 2025 but received an update on March 19th 2026 to include more local immigration partnership boundaries.
To open this dashboard, you will need Tableau Reader installed on your computer. Tableau Reader can be downloaded here.
If you have any questions, comments or issues related to the dashboard, please let us know at information@communitydata.ca.